Technical firm · Industrial energy optimisation

Industrial energy optimisation built on real operating data.

We calibrate thermal and electrical models on what your plant already measures. We identify savings that can be verified under IPMVP Option C. Without modifying your SCADA and without stopping production.

Request initial assessment See methodology

No cost · Technical response within 5 business days

Assessment at no costTen weeks on your data, no commitment
Read-only accessNo write path towards your SCADA
Europe and the United StatesNearly two years operating on industrial plant
ASHRAE G14 Guideline 14-2023 · calibration validated by NMBE and CV(RMSE)
IPMVP Option C · measurement and verification on a 12-month baseline
ISO 50001 Energy management reference · ISO 50015 and ISO 17741
IEC 61000-4-30 Class A power quality measurement · EN 50160 · IEEE 519

Sectors where we apply the methodology

Meat & Food Processing· Data Centers· Plastics & Basic Chemicals· Industrial Refrigeration· Cold-Chain Logistics· Beverages & Brewing· Pulp & Paper·
What we do

Three integrated capabilities, one technical counterpart.

We are neither pure consultancy nor pure software. We operate instrumentation, modelling and verification under a single contract and a single responsibility for the outcome.

Full methodology
01

Overlay instrumentation

We add sensing alongside what you already have, in parallel with the existing control: power quality at the point of connection, thermal probes in plant rooms and cold stores, clamp-on flowmeters and vibration on rotating equipment. Reading without touching the control loop.

  • Class A network analyser per IEC 61000-4-30
  • Class A PT100 probes and differential pressure transmitters
  • Transit-time ultrasonic clamp-on flowmeters
  • Project Haystack v4 / Brick semantic tagging
02

Thermal-electrical modelling and AI

We build a model of the process — thermal generation, refrigeration, compressed air, electrical loads — and calibrate it against measured data following ASHRAE Guideline 14. On that model the digital twin moves from descriptive to predictive.

  • Grey-box models (R-C networks) and black-box models
  • Calibration to NMBE ±10 % and CV(RMSE) ≤30 % monthly
  • Cross-validation by consecutive time blocks
  • Predictive dispatch against forecast demand
03

Measurement, verification and monetisation

Every implemented measure is verified under IPMVP Option C against an agreed baseline, with routine and non-routine adjustments documented. We file the eligible Spanish Energy Savings Certificates and draft PERTE applications.

  • Monthly M&V report, auditable by a third party
  • CAE filing under Spanish RD 36/2023
  • PERTE Industrial Decarbonisation applications
  • Compliance with RD 56/2016 and UNE-EN 16247
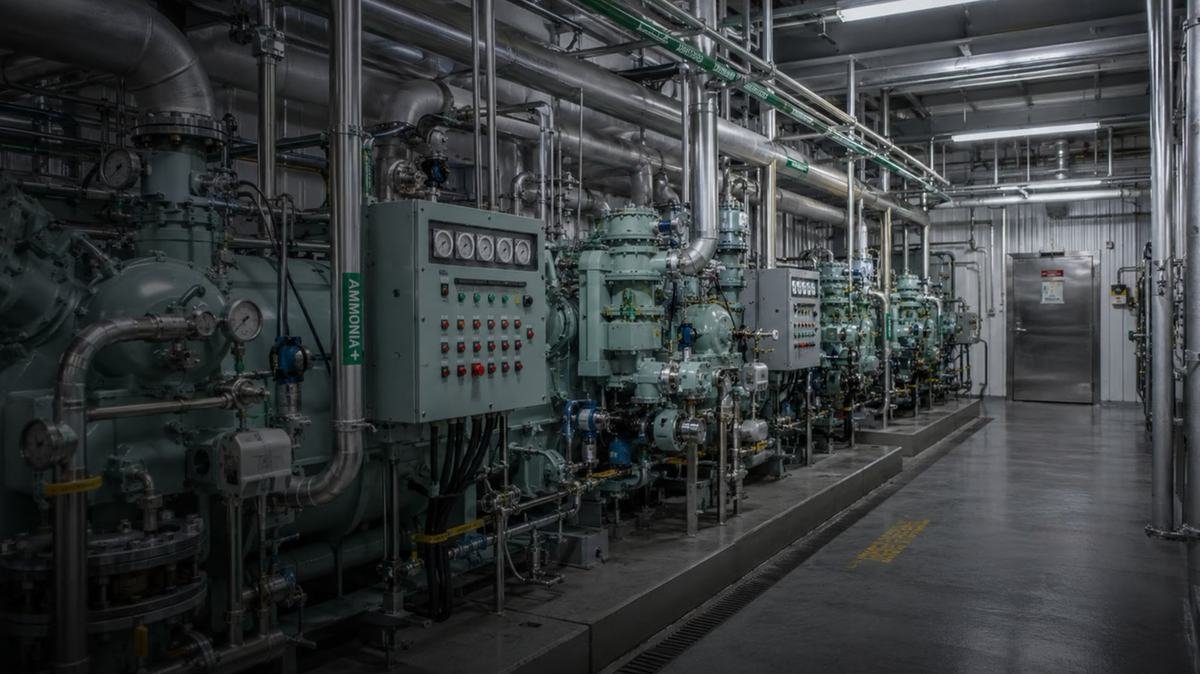
Industrial refrigeration compressor room
Plant rooms and industrial refrigeration
Rack aisle in a data center
White rooms and power quality
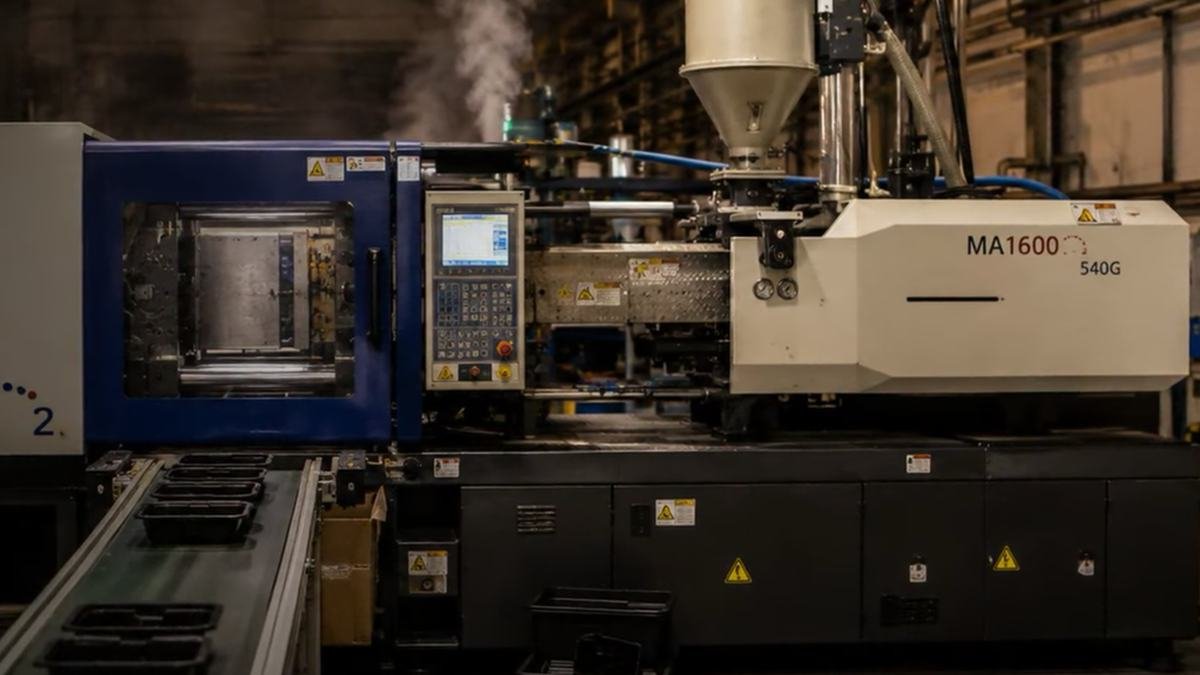
Plastic injection moulding machine on the shop floor
Process, steam and compressed air
Where the savings are

The savings are in how you operate, not in buying new machines.

In a plant with a thermally or electrically intensive process, a substantial share of the bill is decided in setpoints, sequences and schedules. These are the six families where we find it most often, and none of them requires replacing equipment.

LeverMechanismCAPEX
Predictive dispatch of thermal generation Matching the split between biomass, biogas and natural gas to forecast steam demand, closing the gap between installed capacity and the real mix. No
Steam: condensate, blowdown and distribution Condensate return, continuous blowdown governed by conductivity, flash steam recovery and losses through failed steam traps. No
Refrigeration: chilled and glycol water Compressor sequencing by part-load ratio and floating head pressure setpoints against real demand. No
Compressed air: setpoint and leaks Dynamic setpoint pressure and quantification of leaks through a load test during a production stop. No
Electrical: PV, contracted power and reactive Profiling the load curve against on-site generation, adjusting contracted power per period and correcting power factor. No
Rotating equipment: degradation and predictive Detecting energy performance drift in pumps, fans and compressors before it turns into consumption. No

Overlaps between levers are discounted before consolidating. Each one carries a specific data point that confirms it or rules it out — if the data doesn't support it, it comes out of the report.

How we start

Zero cost until the savings are verified. The decision is yours at the end, not at the start.

Ten weeks from signing the NDA to seeing the potential quantified. Only then do you decide whether we continue.

  1. Week 1

    We sign the NDA

    Mutual and already drafted by us. You don't have to draft anything or route it through legal to get started.

  2. Weeks 2-8

    Analysis on your data

    12-month baseline and a digital twin built on your SCADA historian, with read-only access throughout.

  3. Week 9

    We show you the potential

    Validated levers, expressed in MWh and in euros, with the calculation method open and auditable lever by lever.

  4. Week 10

    You decide

    If we continue, 25 % of verified savings. If not, the analysis is yours and there is no invoice.

No verified savings, no invoice. Measurement is in MWh against a baseline agreed under IPMVP protocol. After 36 months the savings become entirely yours, with nothing further to pay.
Reference case · 80 t/day meat plant

Eight operating decisions, zero new equipment.

~€0kof annual savings identified on a plant of this profile

A reference case built on the operating profile of an 80 tonne/day meat processing plant. The figures are aggregated and anonymised: we publish no identifiable client data, no consumption figures and no site locations.

~0 MWhrecoverable per year
~0 tof CO₂ avoided per year
0distinct operational opportunities

First step

Tell us what plant you operate.
We'll tell you if there are savings before charging you anything.

You talk to an engineer, not a salesperson. You send us 12 months of electricity and gas invoices and a photo of the main switchboard. Within 5 business days we come back with a realistic technical forecast. No card, no commitment.

(+34) 648 25 17 07

What you get

  • Technical reading of your energy invoices
  • Preliminary identification of critical operating variables
  • Indicative estimate of claimable CAE certificates
  • PERTE Decarbonisation fit assessment
  • A clear recommendation: proceed or don't